Last updated: October 2026
Between August and September our own Search Console impressions rose from 16,492 to 49,945, while clicks went from 19 to 24. A report that stops at the totals would call that growth. A better one shows what changed underneath. That difference is the heart of local SEO reporting: choosing the numbers that explain what happened and what to do next, not the numbers that merely look big.
This guide gives a six-block report structure for local businesses and agencies, shows what each block should answer and uses a real month-by-month view from our own data as the worked example. Related reading: our SEO audit report template covers one-off audits, and this is the recurring version.
What a Local SEO Report Is For
A local SEO report has three jobs: show whether more of the right people found and contacted the business, explain why, and say what happens next. If a section does not support one of those three, it is clutter. A plumber or electrician wants calls and booked jobs. A multi-location brand wants to know which locations improved and which fell. The report should be built backwards from those questions.
Block 1: Business Profile Performance
Business Profile reports show how people interact with the listing, including calls, direction requests, website clicks and, where enabled, messages and bookings. They also show how people found the profile, from Search or Maps, and the search terms behind it. Report these as monthly counts with the change from the previous month and the same month a year earlier, because local demand is seasonal. For multi-location businesses, show each location in its own row. Our multi-location local SEO guide covers how to structure that.
Block 2: Local Rankings by Area
A single ranking number for a local keyword is misleading, because what a searcher sees depends on where they stand. Track positions across a grid of points around the business and report the share of points where you appear in the top three, not one average. Our geo-grid rank planner helps plan the grid. Pick keywords from real demand, as our local keyword research guide explains.
Block 3: Website Search Data
Search Console shows clicks, impressions, click-through rate and average position for the website. This is where the headline numbers can mislead, so segment them. Here is our own data by month.
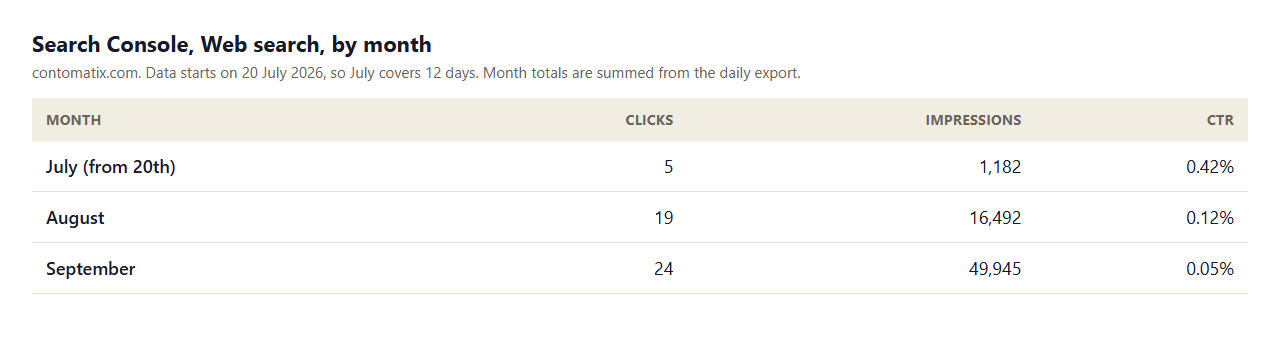
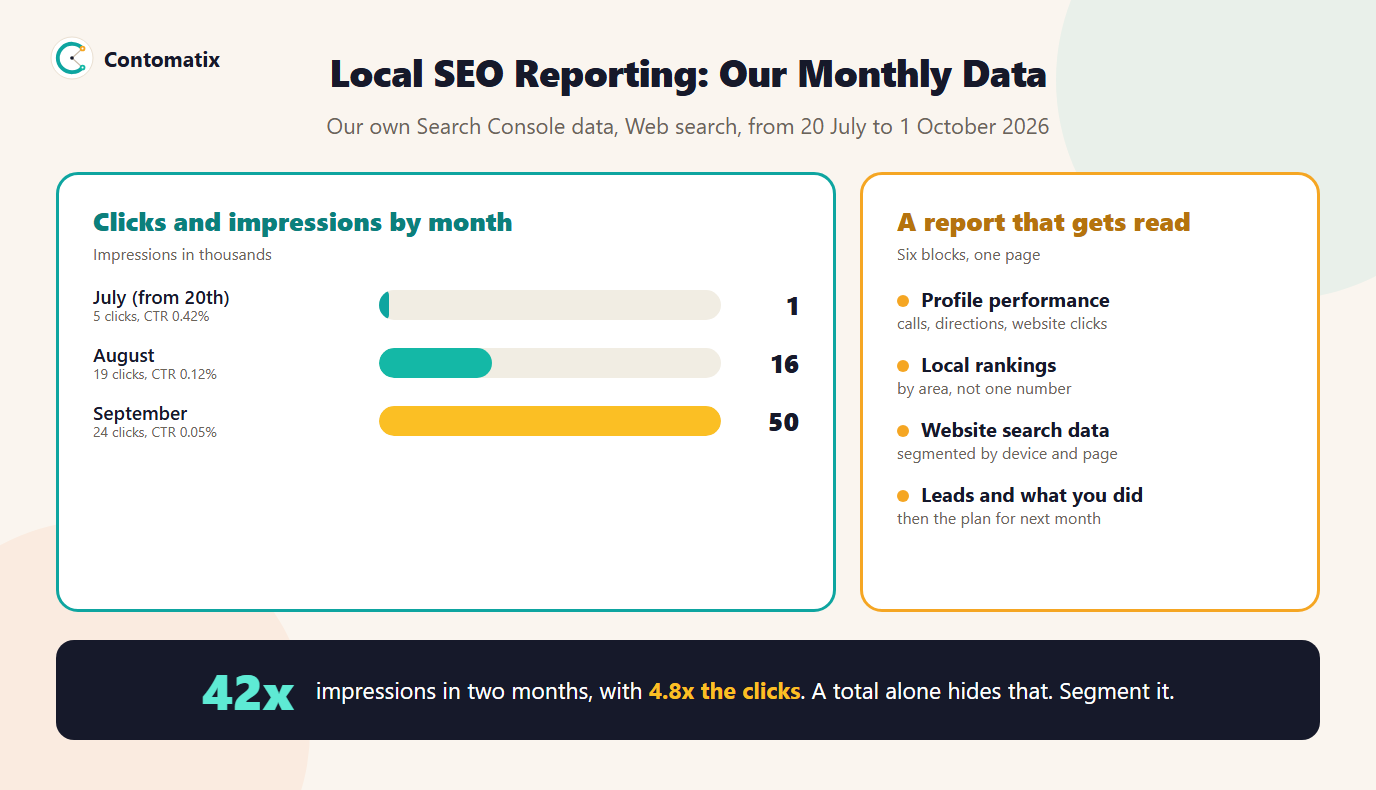
- Impressions grew about 42 times, from 1,182 in the first, partial month to 49,945 in September.
- Clicks grew about 4.8 times, from 5 to 24.
- CTR fell, from 0.42% to 0.05%, because most new impressions came from queries where we sit well beyond page one.
A client reading only impressions would feel good. A client reading only CTR would panic. The report should explain that new impressions at low positions are early visibility, not lost clicks, and show the position distribution behind them.
Segment by Device and by Page Group
Local searches are often on phones, so device is the first split to show.
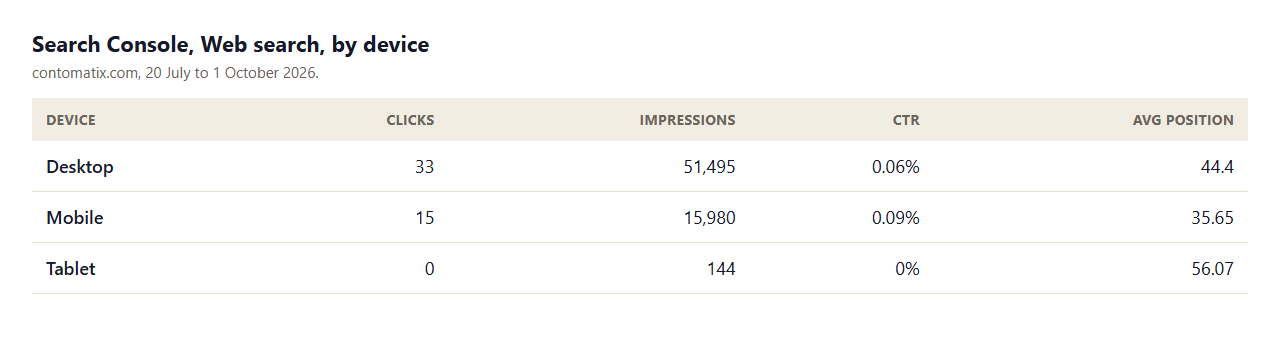
In our data, desktop produced most impressions, but mobile had the higher click-through rate, 0.09% against 0.06%, and a better average position, 35.65 against 44.4. For a local business, a similar split tells you where to look first. Also split by page group, such as service pages, location pages and blog, so the report shows which kind of page earns the clicks.
Block 4: Leads, Calls and Conversions
Rankings are a means, so close the loop. Report calls from the profile and from tracked numbers on the site, form submissions, booked jobs and, if the business can supply it, revenue from those leads. Mark which leads came from search and which came from other channels. If the business cannot share lead data, say so on the page and give the best proxy you have. Do not invent attribution.
Block 5: Reviews and Reputation
Show the number of new reviews, the average rating for the month and the response rate. Add one or two representative review quotes, with permission, that mention a service or area. Flag any review that needs action, such as a negative review unanswered for several days.
Block 6: What We Did and What Is Next
List the work completed in the month, such as profile updates, new service pages, citations fixed and reviews requested, and tie each to a metric it should move. Then list the plan for next month in priority order, with an owner. A report with no plan is a statement of fact, and a plan with no report is a promise.
How Often to Report
Send a short monthly report and review it in a call. Look at weekly data inside the team, but avoid sending it to the client, because local numbers swing from week to week. Compare against the previous month and the same month last year, and allow several months before judging the effect of a change.
Common Reporting Mistakes
- Leading with impressions. They are the easiest number to grow and the weakest proof of results.
- One average ranking. It hides the areas where the business is invisible.
- No comparison. A number without last month or last year is trivia.
- No plan. The report should end with what happens next.
- Too many metrics. If nobody can act on a number, remove it.
Adapting the Report to the Business
- A single-location service business. Lead with calls and booked jobs, then rankings in the service area and the three or four pages that earn the most. Keep it to one page.
- A multi-location brand. Add one row per location for calls, directions and rankings, then a short list of the locations that rose and fell most. Roll the totals up only after the locations.
- An agency reporting to many clients. Use the same six blocks in the same order for every client, so the reader learns where to look, and change only the commentary.
Writing the Commentary
Numbers do not speak for themselves, and most clients will not read a table unaided. For each block, write two or three sentences: what changed, why you think it changed and what you will do about it. A good commentary example from our data reads like this: "Impressions grew about 42 times between July and September, while clicks grew about 4.8 times. Most new impressions came from queries where we rank beyond page two, which is why click-through rate fell. Next month we will improve titles and add links to the pages with the most impressions." That is three sentences, each linked to a decision.
Set a Baseline and Goals Before You Report
A report is only useful against something. Before the first report, record the starting values for calls, direction requests, website clicks, rankings and leads, and write down what you expect to improve and by roughly how much. Goals should relate to the business, such as more calls from the nearest suburb, not to a tool score. Revisit the goals each quarter and drop any that no longer matter.
Access and Data Sources Checklist
- Owner or manager access to the Business Profile, so performance data is available.
- Search Console access for the website property.
- An analytics tool with conversions set up for calls, forms and bookings.
- A call-tracking number or call events on click-to-call links.
- A rank tracker that reports across a grid of local points.
- A way to receive lead outcomes from the business, such as a shared sheet.
What Not to Put in a Local SEO Report
Leave out vanity numbers that nobody acts on: raw domain scores, total keyword counts, the number of citations built and similar activity counts with no outcome attached. Do not show sampled or estimated traffic from third-party tools as if it were measured. If a number cannot be tied to a decision, it does not belong on the page.
A One-Page Report Layout
The best monthly report fits on one page, with detail available behind it. A layout that works for most local businesses uses a top strip with three headline numbers, such as calls from search, direction requests and booked jobs, each with the change from last month. Below that sit the six blocks in order, each with a small table or chart and two or three sentences of commentary. The page ends with next month's plan in priority order. Keep the same layout every month, so the reader finds each number in the same place, and keep older reports so that year-on-year comparisons are easy.
Questions Clients Ask and How to Answer Them
- "Why are we not number one?" Show rankings by area, and explain that results depend on where the searcher is. Report the share of points where the business appears in the top three, and say where you are strong and weak.
- "Why did calls drop this month?" Compare against the same month last year first, since local demand is seasonal. Then check profile views, hours and any change to the listing.
- "Are the leads from SEO?" Show what you can measure, such as tracked calls and form fills from organic and from the profile, and say what you cannot, such as untracked calls.
- "Where should the budget go?" Point to the block with the clearest gap, such as location pages with impressions but few clicks, and propose one change with an expected effect.
Turning the Report Into Action
At the end of each report meeting, agree no more than three actions with owners and dates. At the start of the next one, review them first. This habit turns the report from a record into a loop, which is what clients are paying for. If an action had no effect, say so and drop it. If one worked, explain why and look for the same pattern elsewhere, for example on another location or another service page.
How to Report a Bad Month
Every local campaign has a bad month: a ranking drop after a competitor opens, a listing edit that was reviewed and held back, or a seasonal lull. Report it plainly. State what fell, give the most likely cause backed by data, such as a change in impressions for a specific query group or a drop in profile views, and say what you will do about it. Clients forgive a dip that is explained and acted on. They do not forgive a report that hides the dip in a total or leaves it out. A short note on what you checked and ruled out also shows that the work continues even when the numbers do not move.
Limits of This Example
- Our site is an agency site, not a local business, so there are no calls or direction requests to show.
- The first month in our export is partial, so the growth multiples compare a short month with full ones.
- Search Console figures can differ slightly from other tools, and sampled or anonymised queries are not included in all views.
Key Takeaways
- Build the report backwards from the questions the business owner asks.
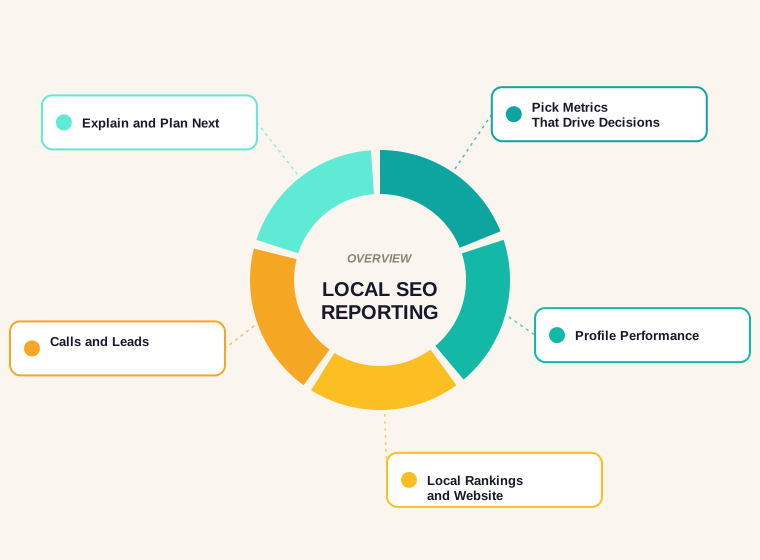
- Use six blocks: profile, rankings, website, leads, reviews and plan.
- Segment search data by device and page group, because totals hide change.
- Always compare with the previous period and the same period last year.
- End every report with next month's plan.
Want a clear monthly report for your local business? Get in touch and we will show you a sample.
Frequently Asked Questions
What should a local SEO report include?
Business Profile performance, local rankings by area, website search data, leads and conversions, reviews, and a list of work done with the plan for next month.
What are the most important local SEO metrics?
Calls, direction requests, website clicks from the profile, leads from search and the share of local grid points where you rank in the top three. Impressions are useful context, but not proof.
How often should I send a local SEO report?
Monthly is the usual cadence for clients, with weekly checks inside the team. Local numbers move too much week to week to be useful in a client report.
Which tools are used for local SEO reporting?
Business Profile performance data, Search Console, an analytics tool, a call-tracking number and a local rank tracker that checks positions across a grid.
Why did my impressions rise while clicks stayed low?
Often the new impressions come from queries where you rank far down the results. In our data, impressions grew about 42 times and clicks about 4.8 times, so click-through rate fell.
How do I report on multiple locations?
Show one row per location for calls, directions and rankings, and add a short note on the best and weakest. A single combined number hides locations that need attention.
Should a report show revenue?
Yes, if the business can supply it. If it cannot, show leads and booked jobs, and be clear about what you could not measure.
What is a geo-grid ranking report?
A report of the positions a business holds for a keyword at several points in a grid around its location, which shows how visibility changes with distance.
How long before a local SEO report shows results?
Expect to compare several months. Early reports show leading indicators such as profile views and rankings, and leads follow.